Race 4 · wind at the top
DataView · sailing telemetry, replayed
Where was the race won, and by how much?
DataView puts every boat's 10 Hz telemetry on one dashboard: tracks, speeds, manoeuvres and legs, read straight from the Polutropon analytics engine. The debrief starts from the data, not from memory.
- Geneva · 19 Sep 2026
- 13 boats · 9 marks
- 79 channels at 10 Hz
What DataView is
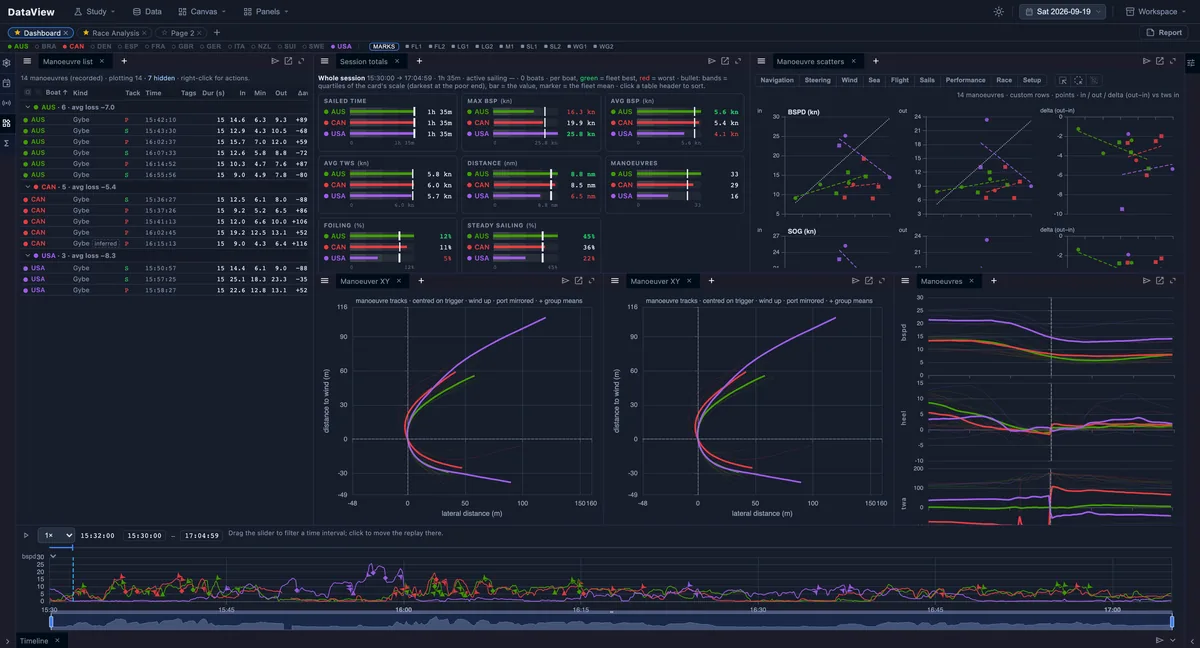
One dashboard for the whole fleet
Pick a day and the boats you care about. Tracks, charts, lists and the timeline all follow one clock, so scrubbing to any second moves every view together.
Drag on any time chart to select a stretch, and every other view highlights the same stretch.
Replay
Scrub, play, cut
Any second of the session at 1–10×; drag the timeline to cut the analysis to a stretch of it.
Manoeuvres
Every tack and gybe
Entry, minimum and exit speed, loss, tags and formulas, overlaid traces and tracks.
Races
The race page
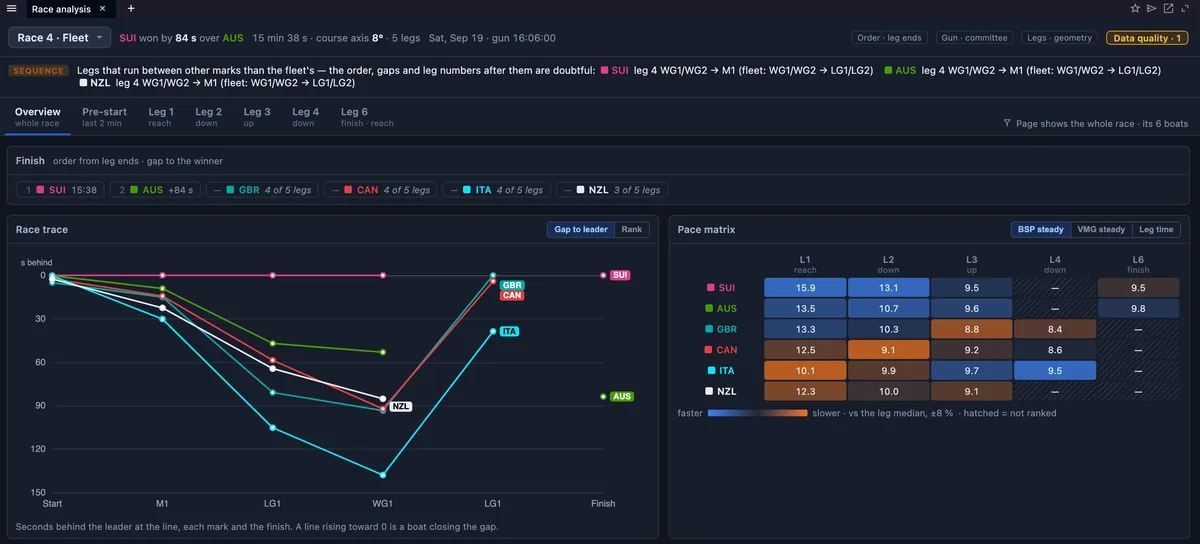
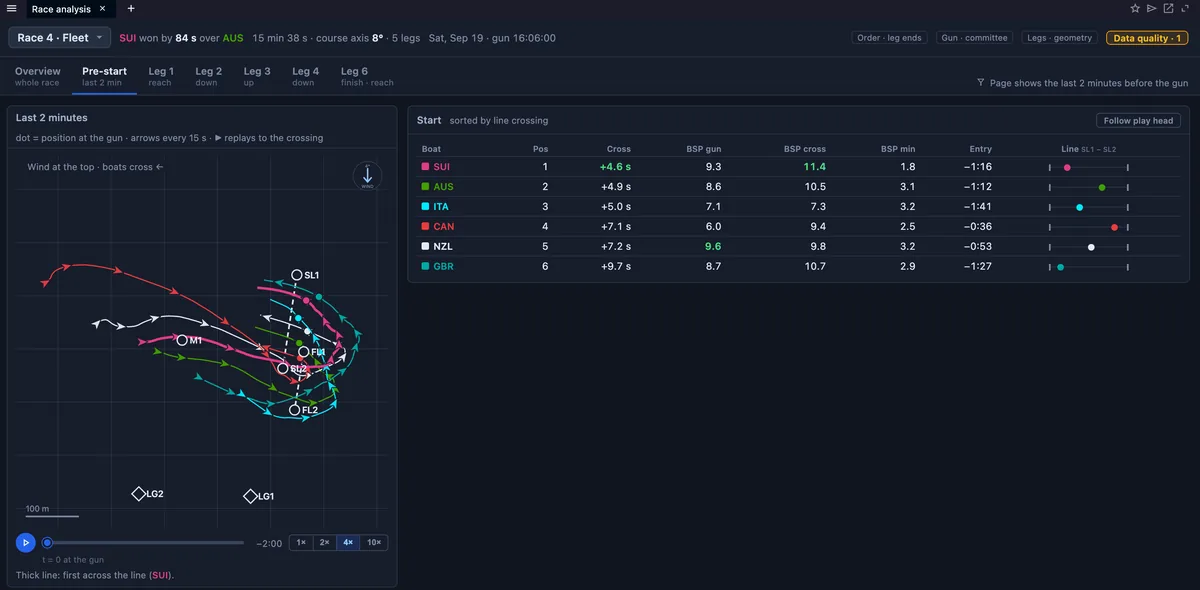
Results, gap trace, pace per leg, the start, and a leg table that follows the play head.
Totals
Session totals
Sailed time, distance, speeds, counts, foiling share and side biases, per boat.
Reports
Send to a report
Any chart or table goes to a report: interactive HTML, Markdown or print.
Datasets
Across sessions
Query manoeuvres or straight lines over many days and open them as one dataset.
Why the numbers hold
Every number comes from the store, and says where it came from
-
Read where the engine wrote it
Polutropon ingests the boats' feed into 10 Hz Parquet files and a catalogue. DataView reads both directly and decodes each channel in the browser when a view needs it. It keeps no copy of the catalogue and does not alter a sample.
-
One vocabulary, the engine's
Channel groups, units, event types and metric names come from the engine's own description of itself, so a "tack" or a "leg" means the same thing in the pipeline and on screen.
-
Events detected and coached upstream
Tacks, gybes, legs, mark roundings and straight lines are detected by the engine, which also computes their coaching metrics. DataView shows them as they were computed.
-
Doubts are shown, not smoothed over
Each race states its sources: the order comes from leg ends, the gun from the race committee, the legs from course geometry. When the engine's leg sequence disagrees with the fleet's, the race page raises a data-quality flag.
Order · leg endsGun · committeeLegs · geometryData quality · 1
The worked example
One afternoon on Lake Geneva, three boats
Saturday 19 September 2026, Geneva: the session stored by Polutropon, opened in DataView with AUS, BRA and FRA on the whole series. The wind was light: these boats averaged 5.6–5.8 knots of true wind.
1 h 35 minsailed, 15:30–17:05 local
13 + 9boats and course marks
2,906events detected by the engine
6races in the committee list, 5 with legs
| Boat | Sailed | Max BSP | Avg BSP | Avg TWS | Distance | Tacks | Gybes | Manoeuvres | Steady sailing | Foiling |
|---|---|---|---|---|---|---|---|---|---|---|
| AUS | 1h 35m | 16.3 kn | 5.6 kn | 5.8 kn | 8.8 nm | 4 | 6 | 33 | 45% | 12% |
| BRA | 1h 35m | 24.1 kn | 4.3 kn | 5.6 kn | 6.8 nm | 4 | 4 | 40 | 28% | 10% |
| FRA | 1h 35m | 25.6 kn | 3.8 kn | 5.6 kn | 6.1 nm | 3 | 5 | 19 | 23% | 11% |
Values as DataView's Session totals panel reports them for the whole session; green = best of the three, red = worst, as in the app. Manoeuvres = tacks + gybes + head-ups + bear-aways. Foiling = share of sailed samples with no hull in the water.
Race 4 · Fleet · gun 16:06:00
Scroll to sail Race 4, mark by mark
Six boats, 15 minutes 38 seconds from the gun to the winner. The map below is drawn from the boats' recorded GPS positions, with the wind at the top, as on DataView's race page. Every number in the story comes from the same data the race page reads. Where the feed lost the positions, the track is dashed: rebuilt from speed and course over ground.
Explore it yourself
Any second, any boat
Drag the slider or press play (10×). Switch boats on and off. The speed chart and the table follow the same instant.
Race 4
T−2:30
| Boat | BSP | TWA | VMG | Foils |
|---|
The race page
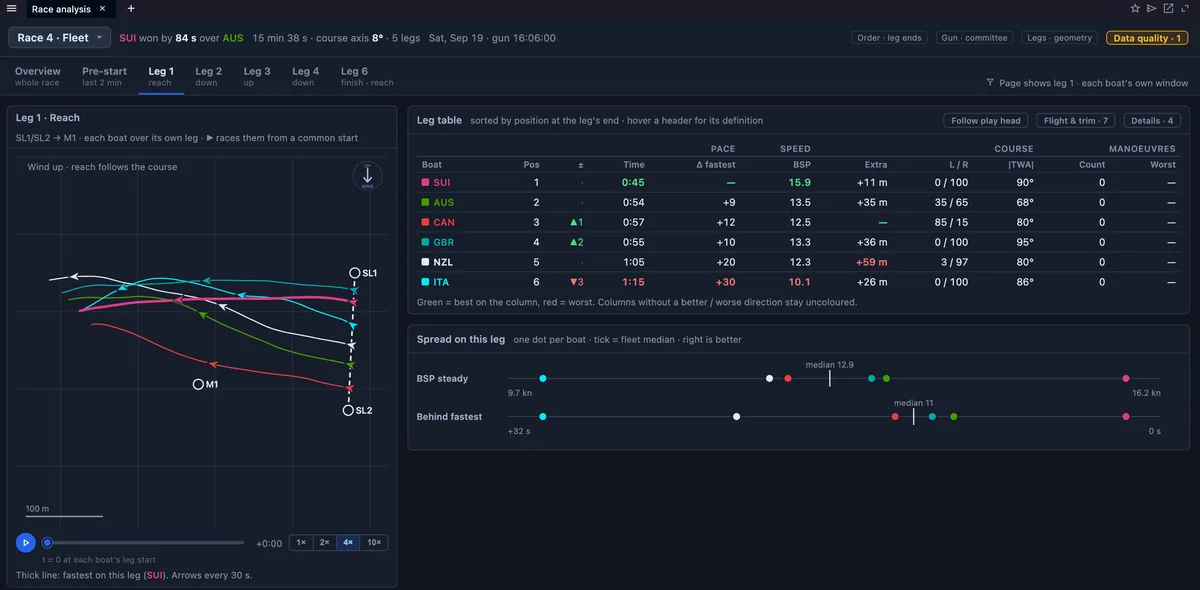
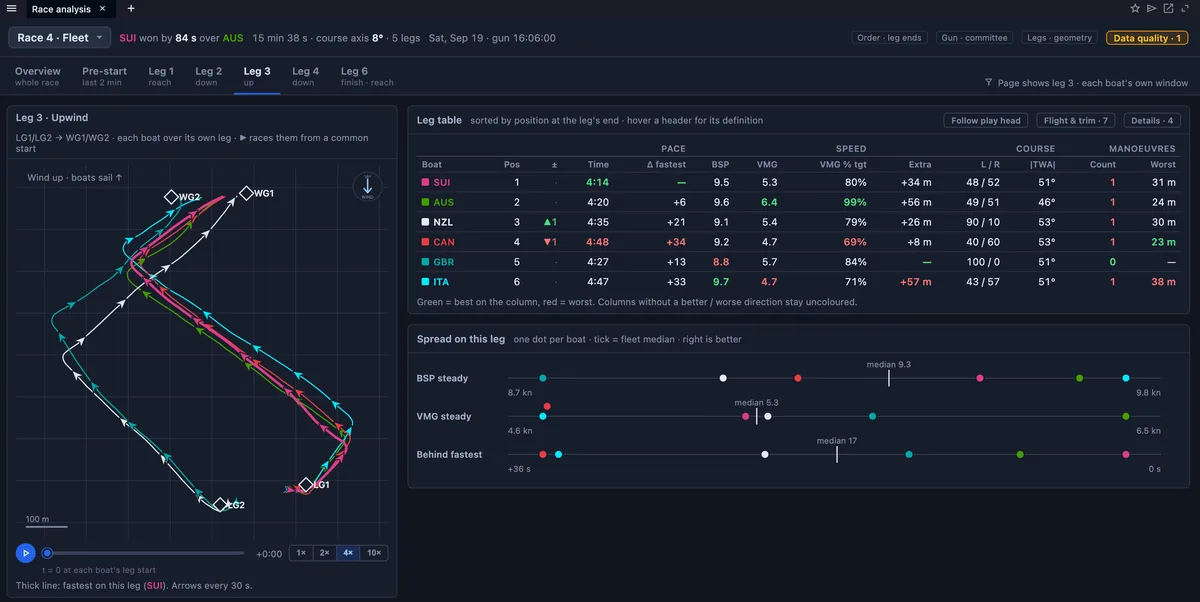
Race 4 as DataView opens it
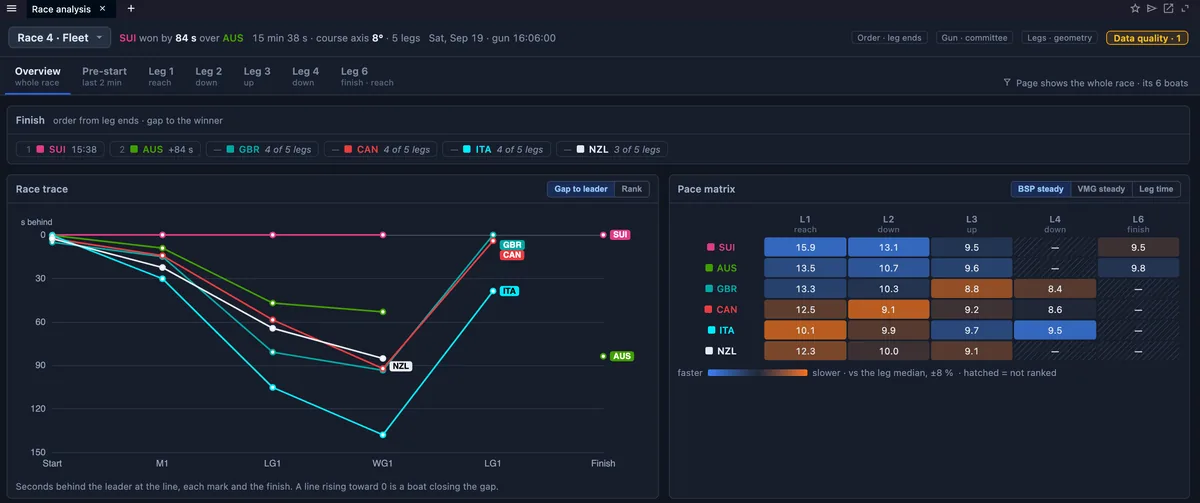
Bind a page to a race and its tab sets the data for every item on the page: the whole race, the last two minutes before the gun, or one leg, where each boat is shown over its own leg window.
Manoeuvres
Every tack and gybe, side by side
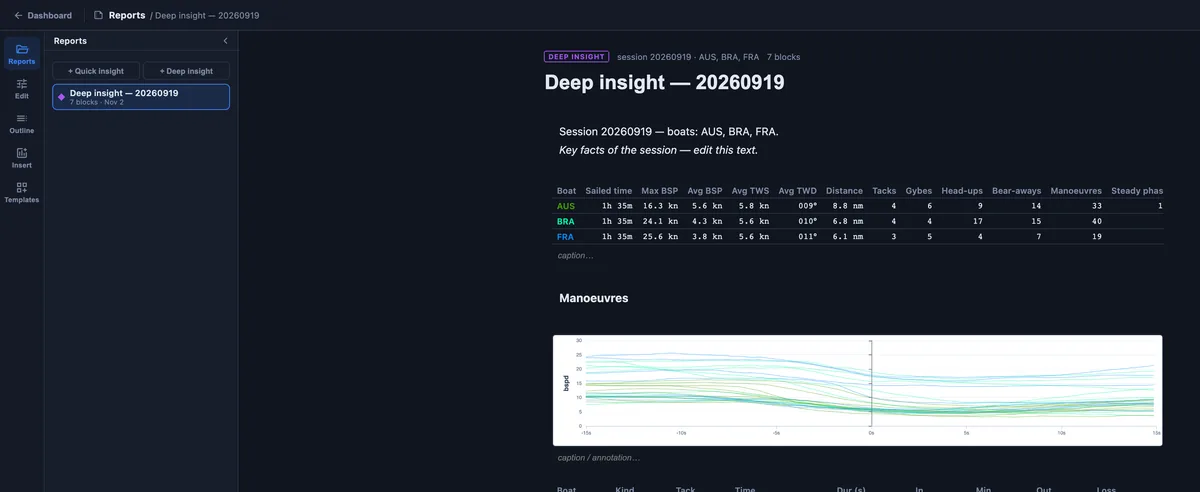
Each manoeuvre is aligned on its trigger, so dozens of them overlay into one picture: how much speed a boat carries in, how deep it dips, how fast it rebuilds. In the app the list ranks them by loss; tags, formulas and colour groups (boat, tack, wind band, loss quartile) slice them further.
Boat speed from 15 s before to 15 s after each recorded tack and gybe of the whole session; thin lines are single manoeuvres, the thick line their mean. Drawn by this page from the same 10 Hz data DataView reads.
Across races and the season
Compare the same situation over many races
A dataset gathers one kind of moment from as many sessions as you choose: every tack, every gybe, every straight line upwind, for the boats you pick. It can be narrowed by venue, tack or coached metric, for example only tacks entered above a given speed. Each moment is placed side by side on one clock, so the manoeuvre charts, tracks, list and scatters compare them as if they came from a single session.
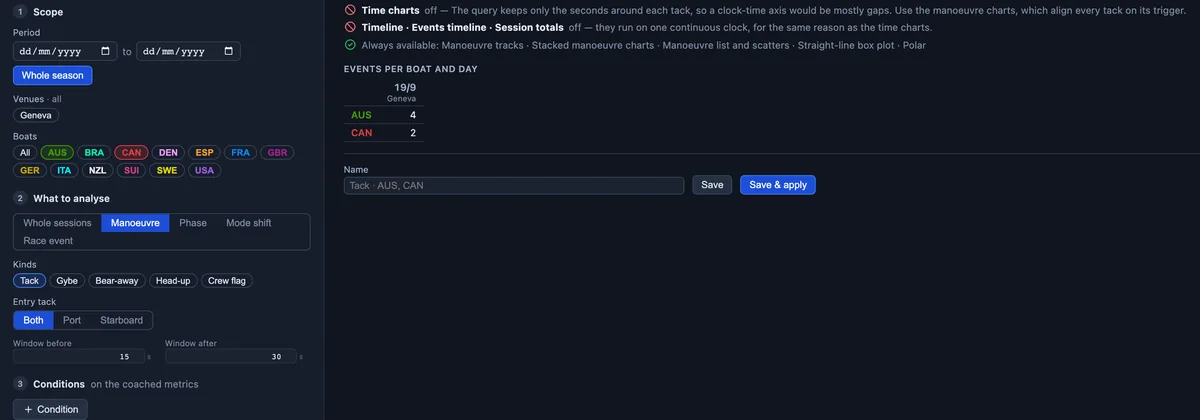
That answers questions a single day cannot, such as how AUS tacks against CAN across the whole season: the speed it carries in, how deep it dips, and how fast it rebuilds, over every race both sailed.
-
A preview before anything is built
How many events, boats, days and venues; how much data it reads; which views make sense. A clock-time chart, for instance, would be mostly gaps.
-
Warnings when a comparison would mislead
Too few events, a wide spread of wind, or mixed event families are flagged before the dataset is built.
-
Saved, and opened like a session
A dataset appears in the session picker. Open it and the manoeuvre list, charts, tracks and scatters work on it as on any session; views that need one continuous clock step aside.
Made to measure
Shaped by the question, not by the tool
A coach debriefing starts, a performance analyst chasing manoeuvre losses and a designer reading the wing do not want the same screen. In DataView each of them builds their own.
Layout
Pages you arrange
Drag components and charts onto the dashboard; split, stack or tab them; keep one page per kind of question.
Data
Each item its own data
One chart on two boats, the next on one leg of one race; every item can narrow the common data.
Settings
Per item, or shared
Colour groups, channels, sorting and chart style apply to one item or to every item of its kind.
Rules
Tags and formulas
Tag manoeuvres by hand or by a rule such as min(bspd) < 30 && kind == "gybe"; build totals cards from formulas.
Charts
Your channels, your look
Any of the session's channels in any chart; boat colours, cell colour scales, numeric line styles.
Studies
Save the whole working state
Session, boats, cut, play head and layout in one named study, reopened exactly as it was left.
Reports
From the dashboard to the debrief
Every panel has a send action. Charts arrive in a tray as live charts you can resize and annotate before they are rasterised; tables keep their conditional formatting and boat colours. A template builds a first draft from what is on the page.
Export a deep insight as an interactive HTML page, or a quick insight as Markdown, static HTML or print.
How an analyst works it
Pick the day. Pick the boats. Ask.
- STEP 1
Open a session
The session picker lists every day Polutropon has stored, with its fleet.
- STEP 2
Choose the boats
Boat tags under the top bar; every view follows. Items can narrow further.
- STEP 3
Cut and compare
Drag the timeline to a stretch, bind the page to a race and pick a leg, or open a dataset of many races.
- STEP 4
Send it on
Send charts and tables to a report and export it for the team.
What it is, and is not
A replay of what the boats recorded
- The finishing order is derived from when each boat ends its last leg. No official results or penalties feed the race page.
- Legs are numbered as the engine records them. In Race 4 they are 1, 2, 3, 4 and 6: no leg 5 was detected.
- A doubtful leg is flagged, not corrected. The leg 4 of SUI, AUS and NZL is left unranked; DataView does not rewrite the engine's events.
- Positions can drop out of the feed. In Race 4 every boat and mark lost GPS for 107 s (T+12:33 to T+14:19), while speed and course over ground kept recording. This page draws that stretch dashed, rebuilt from speed and course; DataView's own map leaves it blank.
- Values are the instruments' values as the engine processed them. DataView decodes and plots them; it does not filter or edit them.
- This was a light-air day. AUS, BRA and FRA were foiling for 10–12% of their sailed time, so speeds and manoeuvre losses read differently from a breezy day.
Contact
See your own racing in DataView
We will open one of your sessions with you: your boats, your races, your questions.
Contact address to be confirmed